- Home
- Sponsors
- Forums
- Members ˅
- Resources ˅
- Files
- FAQ ˅
- Jobs
-
Webinars ˅
- Upcoming Food Safety Fridays
- Upcoming Hot Topics from Sponsors
- Recorded Food Safety Fridays
- Recorded Food Safety Essentials
- Recorded Hot Topics from Sponsors
- Food Safety Live 2013
- Food Safety Live 2014
- Food Safety Live 2015
- Food Safety Live 2016
- Food Safety Live 2017
- Food Safety Live 2018
- Food Safety Live 2019
- Food Safety Live 2020
- Food Safety Live 2021
- Training ˅
- Links
- Store ˅
- More
Advertisement
Featured Implementation Packages
-
SQF (& FSMA) Implementation Package for Food Manufacturers - Edition 9 (2023 Update)
This comprehensive documentation package is available for immediate download and... more
-
SQF Implementation Package for Storage & Distribution Operations - Edition 9
This comprehensive documentation package is available for immediate download, ca... more


Particle Contamination in Compressed Air: Choosing the right analytical method per ISO 8573
Nov 28 2019 07:49 PM | Simon
compressed air testing
ISO 8573
ISO 8573 has 9 parts, with one dedicated specifically to particle contamination (ISO 8573-4). Section 4 mentions liquid, viable, and non-viable particles as possible contamination in compressed air. The focus of this article will be on analytical methods for non-viable particle contamination specifically.
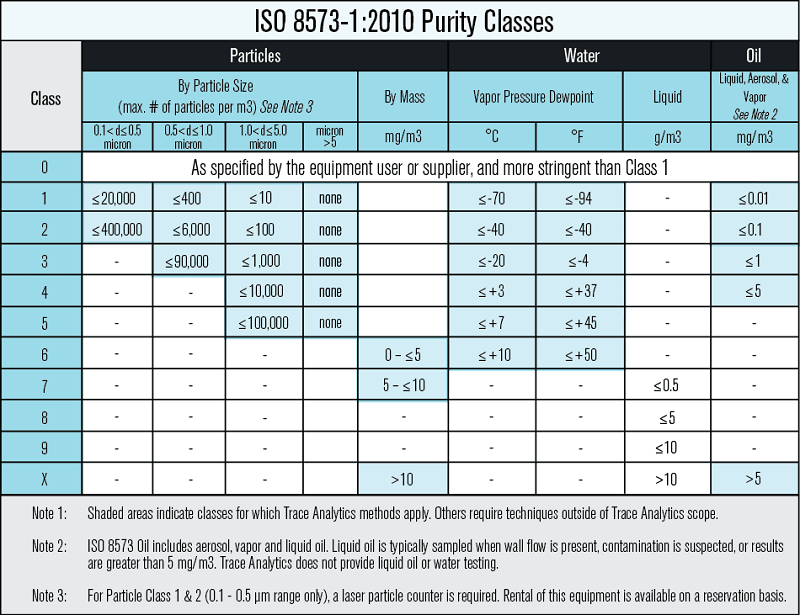
According to ISO 8573-4, non-viable particles are characterized by their size, shape, transparency, color, and material. ISO 8573 provides purity classes based on size ranges for particles. Learn more in the chart below.
TYPES OF PARTICLE ANALYSES
Gravimetry, microscopy, laser particle counters, and SEM are methods that can be used to test for particle contamination in compressed air. Not all types of analysis are appropriate for all systems or specifications. It is critical to work with a third-party accredited laboratory to ensure your results are accurate and that the type of testing performed is right for your facility’s needs.
Gravimetry
Gravimetry is the analysis of particles by mass. Sampled on a filter membrane, compressed air is passed through and any particles are captured on the membrane. The filter is then transported to a third-party laboratory and weighed. According to ISO 8573, gravimetry is appropriate for the analysis of particle contamination for applications that require a Class 6, 7, or X.
Sampling for gravimetric analysis takes only about 5 minutes and requires about 250 liters of air. It is important that ambient air does not impact the filter membranes as ambient air is often full of particles. Depending on the facility, there could be dust, powder, plastics or other non-viable and viable particles circulating in the air. Gravimetric analysis must consider the influence of temperature, pressure, water vapor, and other contaminants (Ochoa, 2016).
Filter membranes can capture oil aerosol in addition to particle contaminants, and in some cases, it may be necessary to separate the two. Maria Sandoval, Laboratory Director at Trace Analytics, LLC, states: “Gravimetry relies on pre and post weights of filter membranes upon fabrication and sampling respectively. If sampled weight exceeds a specification limit, oil aerosols can be extracted, the filter reweighed, and oil aerosol concentration extrapolated.”
Low risk applications can consider gravimetry in order to ensure that their compressed air meets requirements laid about by ISO 8573 or their corporate standards.
Microscopy
Microscopy allows for the characterization of particles by size and shape. Light Optical Microscopy is an appropriate method of analysis for purity classes 3-5. This method allows for the lab technician to categorize the particles by size, group them into ranges, and then count the totals. Sampling for purity classes 3-5 lasts only about 10 minutes, and requires a minimum of 500 liters of air volume. Once air passes through the filter membrane, it is returned to the lab for analysis by trained lab technicians and scientists.
“At Trace, we use Bright Field Microscopy to analyze filter membranes that may be contaminated with particles. Depending on the specification, we can use high or low objective to bin the size particles for reporting. In the event that further particle characterization is required, the filter membrane can be sent to scanning electron microscopy for further analysis,” Sandoval states. For most applications, microscopy is appropriate and allows manufacturers to meet their requirements.
Sandoval mentions that there are both advantages and disadvantages to using microscopy: “Using this technique, not only can a particle be sized, but its characterization can also be determined (e.g. color, topography). This requires the use of technician-driven analysis, which can be time consuming.”
Laser Particle Counter
Laser particle counters also report the number of particles in different size ranges. Compressed air is passed through a high pressure diffuser and then through an LPC which analyzes the size and number of particles present in the air at that time. Companies with higher risk applications, often pharmaceutical or high-risk food manufacturers, will opt for laser particle counters in order to reach purity classes 1 and 2. Expensive and sensitive instruments, laser particle counters can provide on-site test results and can act as troubleshooting devices (Ochoa, 1999).
Sandoval notes that, “LPC’s have limitations such as, but not limited to, the lowest size particle they can detect. When researching use of LPC for particle analysis, the facility should always consider the particle range their facility specification requires to be reported to. Also note that LPC’s are limited because they’re calibrated to spherical, standardized particles, so if an irregular shaped particle crosses the laser, the LPC will assign the closest sized spherical range to that irregular shaped particle.” This creates a disadvantage for use of LPC for reporting particle analyses as they can only differentiate by size; however, particles can be reported instantly, saving the manufacturer time. Instant results represent a time-saving opportunity, but the lack of size differentiation might not be appropriate for all applications.
Scanning Electron Microscope (SEM)
In some circumstances, manufacturers will want further identification, or need additional help troubleshooting contamination. SEM (scanning electron microscopes) can reveal the texture and chemical composition of particulates. According to Metallurgical Engineering Services, “the scanning electron microscopes will allow you to view surface features at 5 to 300,000X magnification to provide you with high quality, depth of field images. When used with EDS detectors attached to each SEM, the chemical composition of surface features is quickly attained” (2019). Analyzing particles using SEM is advantageous over use of optical microscopes as it provides a focus on irregular fracture surfaces. For most applications, this level of specificity is not necessarily required, but it can be employed as a type of particle analysis.
RISKS OF CONTAMINATION AND INAPPROPRIATE ANALYSES
Contamination poses a great risk both to the safety of the product and to the efficacy of the system. Inappropriate analysis could cause serious contamination to be missed. It could also be overly stringent, causing a failed test result when air quality was at an acceptable level.
Particle contamination can occur from a variety of sources. The compressed air system itself is often a major source of contamination. Rusty pipes, the use of mixed metals, polymer hoses, o-rings, damaged filters or solder can all result in particle contamination of compressed air or gas. Maintenance events or system alterations can also negatively impact the quality of the system. Ambient air has tons of particles and when a system is exposed to ambient air, even for a short period of time, the system can become contaminated. Because particles can originate from so many different places, and can appear in many different sizes and shapes, it is critical for a manufacturer to understand their system’s risks and the necessary specifications they should adhere to.
Any particle contamination can be harmful to consumers. No consumer wants metal shavings in their coffee grinds. Performing a risk assessment can help manufacturers determine the unique challenges their system might face. This can also help determine which kind of particle analysis is best suited to their requirements.
SUMMARY
Manufacturing industries can ensure product safety and quality through appropriate analysis of particle contamination in their compressed air systems. As individual facilities encounter varying risks, careful determination of particle analysis methods should be made in order to meet ISO 8573 or corporate standards.
Analysis through gravimetry, microscopy, laser particle counters (LPC), and a scanning electron microscope (SEM), can each be employed to determine particle contamination depending on the necessary requirements.
TESTING WITH TRACE ANALYTICS, LLC
Trace Analytics, LLC is an ISO 17025-accredited laboratory specializing in the analysis of compressed air. Testing at Trace includes the analysis of particles, water, and oil contamination according to ISO 8573 standards through the use of gravimetry, microscopy, and Laser Particle Counter (LPC) techniques. To learn more about compressed air testing for particle contamination and packages offered at Trace, visit www.AirCheckLab.com.
References:
ISO 8573-4:2019. International Organization for Standardization
Metallurgical Engineering Services. “SEM Analysis - Metallurgical Engineering Services.” Metallurgical Engineering Services, 2019, metengr.com/testing-services/metallurgical/sem-analysis/. Accessed 29 Aug. 2019.
Ochoa, Ruby. “Sampling and Testing for Compressed Air Contaminants.” Sampling and Testing for Compressed Air Contaminants | Compressed Air Best Practices, Air Best Practices, 2016, www.airbestpractices.com/standards/food-grade-air/sampling-and-testing-compressed-air-contaminants.
Sandoval, Maria. “Particle Analysis at Trace Analytics.” 28 Aug. 2019.


0 Comments